Incipia blog
Mobile Marketing Strategies - Event Prospecting
This post is a summary explanation to go with this deck that was presented at the AppsFlyer MAMA East event in June 2019.
You can access the slides here.
The purpose of analyzing events is to identify behaviors (defined by events) which correlate with (and ideally predict) a particular outcome of future behavior. This topic follows the shift of marketing targeting from grouping users by interests or surface-level trends, to grouping users by similar behaviors, covered in this blog post on Mobile Dev Memo.
A simple example of this is to figure out which events predict that an average user will become a subscriber. Once divined, these trends can help guide a marketing team through creative production, targeting, budgeting, bidding, and so on. The outcomes of this analysis also don’t have to be limited to advertising, but can also be applied to product management, referral marketing, engagement marketing, onboarding, pricing, and many more avenues.
For instance, Facebook famously used event prospecting to uncover several key learnings, such as identifying the number of friends required before users experienced a “magic moment” and became sticky users, or a similar finding around the fact that users who saw notification badge icons spent far more time consistently using the app. Both of these findings led Facebook to execute different types of marketing efforts to drive users to those targeted behaviors, which (among other things) helped propel Facebook to history-making success.
The first step is to define the behavior that you want to result from your prospecting. Do you want people to…
- Become one of your power users?
- Become a valuable user, as defined by segments (e.g. minnows, dolphins, whales)?
- Become a valuable user, as defined by a model (e.g. LTV)?
The second step is to gather the data, ensuring that you have the following attributes necessary to study event trends for each user in your sample:
- User’s installation date – used to cohort users together by age, as well as determine the chronological order of events.
- User ID (e.g. IDFA, advertising ID, email) – your unique key to tie multiple events to a single user.
- Event timestamp – the type of event and when it occurred.
- Revenue – if the event generates revenue, then you’ll need to know how much revenue was produced.
After getting your data in order, you can start the analysis. Our approach follows three steps, with gradually increasing complexity of behaviors prospected:
Correlation / Regression
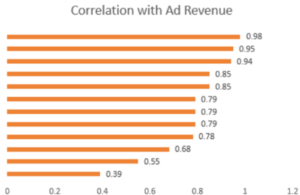
Step one is a correlation / regression analysis, which involves building a linear regression (or other) model that compares the trends of a series of independent events for each user, and the corresponding trends of the dependent desired outcome variable. The goal is to determine which independent variable(s) is most correlated or influential of the desired outcome.
For instance, you could study a combination of five events, which can be anything you have confidence may be present in users who complete your desired outcome. (e.g. app opens, users who were active every day of the week, users who opened a push notification, users who used a special feature, content views, etc.). The events may be either single occurrences or many-per user.
Your correlation analysis could, for instance, uncover which of the studied events had the largest correlation with ad revenue-based user LTV.
Inflection Point
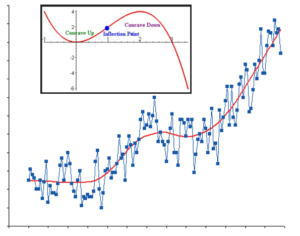
Inflection point analysis is step two, wherein you analyze the trends within the event from step one. This involves grouping users by each unique total count of the event and averaging their desired outcome (e.g. ad revenue LTV) at each count. The analysis determines what total count indicates that, for every additional count of the event the increase in a user’s desirability becomes slightly less large than the previous event count (i.e. a diminishing return).
Scatter plot your data and then draw a smoothed trendline through the data. You will likely see that the line is at first flat (indicating a low correlation between more completions of the event and your desired outcome), followed by a rapid increase in the desired outcome. The inflection point assesses the first derivative of the curve of the line, where the slope turns from concave up to concave down.
While you will see several inflection points, the purpose is to find the earliest maximum level of your desired outcome.
As an alternative to the point of diminishing returns, if your goal is to simply get users to some desired level, you could study the point at which your level of the desired outcome occurs (e.g. how many app opens are required for users to reach ~$4 in ad revenue LTV?).
Even if the event occurs only once, such as a signup, you can still study trends within that event, such as the time to complete the event, which could reveal whether users who complete the event more quickly have a higher likelihood of reaching your desired outcome.
Decision Tree / Random Forest Analysis
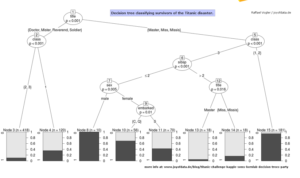
Step three is to identify whether a combination events is more influential of your desired outcome than a certain count of an individual event. This can often be the case, that it is some set of behaviors that together correlate with more confidence with your desired outcome than a single event.
This analysis is a common sample project for data scientists, applied to the problem of predicting which passenger attributes predicted that a passenger would survive the Titanic disaster.
There are many applications for event prospecting, but a consideration for any application is the balance between feasibility of using the behavior (i.e. are enough people reachable by operating on that event or event combination) vs confidence of the behavior to predict your desired outcome (i.e. correlation strength). If you have found an event which every user completes (e.g. as installing your app), then this behavior will not be strong enough to help find you the most valuable outcomes (e.g. reaching a ~$4 ad revenue LTV); yet if you find an event that too small a subset of users complete (e.g. opening your app 1,204 times), then the likeliness of future users completing that behavior will likely be too small to be of use in scaled marketing.
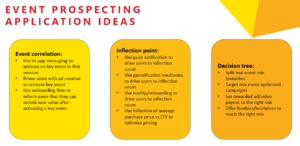
Applying the results can range widely, but for instance may be to identify which events are common in a power user segment that are lacking in other segments or tuning an advertising targeting algorithm to find users likely to complete a behavior.
In any case, the challenges in applying your findings can include some of the following:
- Ensuring that events & desired outcomes are independent / not correlated (e.g. purchases and ARPU) – correlation analysis cannot study events where the dependent variable is correlated with an independent variable, because this would skew the correlation strength towards this independent variable and give other events a lower score. For example, you cannot study whether the act of purchasing is stronger than the act of some other key action for predicting that a user will become a whale, because a purchase produces revenue. In this case, you would need to study purchases separately (such as in an inflection point analysis).
- Selecting the right model (e.g. normal/not data distribution OR monetization model) – many analyses assume a normal variation (i.e. a bell curve), where there is a “normal” distribution of user behavior, aside from an occasional outlier. If your data set is not normally distributed, your data may need to be transformed, or you will need to select a different model. Similarly, you may need to use a different model or approach depending on whether you are studying one time in-app purchases vs subscriptions, given the underlying assumptions of user behavior in each monetization model.
- Cost to leverage the data (product vs advertising vs push notification) – while event prospecting analyses can be widely applied, each application will require a different level of effort to realize. Prototype findings with applications that have lower costs to build support for a larger implementation.
- Transferring findings from the lab into the real world (e.g. the Hawthorne effect) – the last concern mentioned in this presentation is that of artificially affecting the desired outcome by attempting to optimize for it. Be sure to re-study the correlations of events and your desired outcome after running a marketing campaign against the findings of your analysis to determine whether the correlation levels have shifted.
That’s all for today! Thanks for reading and stay tuned for more posts breaking down mobile marketing concepts.
Be sure to bookmark our blog, sign up to our email newsletter for new post updates and reach out if you're interested in working with us to optimize your app's mobile advertising or ASO strategy.
Incipia is a mobile marketing consultancy that markets apps for companies, with a specialty in mobile advertising, business intelligence, creative, and ASO. For post topics, feedback or business inquiries please contact us, or send an inquiry to projects@incipia.co
Categories
Tags:
- A/B testing
- adjust
- advertising
- adwords
- agile
- analytics
- android development
- app analytics
- app annie
- app development
- app marketing
- app promotion
- app review
- app store
- app store algorithm update
- app store optimization
- app store search ads
- appboy
- apple
- apple search ads
- appsee
- appsflyer
- apptamin
- apptweak
- aso
- aso tools
- attribution
- client management
- coming soon
- design
- development
- facebook ads
- firebase
- google play
- google play algorithm update
- google play aso
- google play console
- google play optimization
- google play store
- google play store aso
- google play store optimization
- google uac
- google universal campaigns
- idfa
- ios
- ios 11
- ios 11 aso
- ios 14
- ios development
- iot
- itunes connect
- limit ad tracking
- ltv
- mobiel marketing
- mobile action
- mobile analytics
- mobile marketing
- monetization
- mvp
- play store
- promoted iap
- promoted in app purchases
- push notifications
- SDKs
- search ads
- SEO
- skadnetwork
- splitmetrics
- startups
- swift
- tiktok
- uac
- universal app campaigns
- universal campaigns
- user retention
- ux
- ux design