Incipia blog
Facebook Lookalike Audience Saturation Part 1
This post encapsulates some theories as to why marketing performance may suddenly decline after running a particular audience for some time, and if so how to address this issue. Also known as audience saturation.
Catch part 2, which covers how to optimize against saturation here.
While this post focuses on the mechanics of lookalike audiences, the concept can be applied to any audience, with minor nuances in the mechanics. For example, audience excavation in non-lookalikes occurs as Facebook obtains data on users who fit those audience profiles (e.g. a user mentioning the word “fitness” in a message, and thus being tagged as a user interested in fitness).
What is a lookalike audience?
A lookalike audience is the term given to a group of users that Facebook has determined “look like,” or have some set of characteristics in common with a custom or “seed” audience. Lookalike audiences are referred to by different monikers, such as “actalikes’ in Pinterest, or ‘audience hints” in Google UAC.
Seed audiences are users grouped by some particular behavior or trait that is deemed valuable by an advertiser. While the most common seed audience and lookalike is users who have purchased, seeds can be grouped by anything meaningful to the advertiser, including users who share a combination of behavior correlated with or known to be associated with high monetary value.
Lookalikes are created when an advertiser uploads a seed audience to Facebook and selects a lookalike percentage(s) and country source(s). Facebook then searches for those users in the seed audience in its database (e.g. by matching IDFAs in the seed audience with IDFAs of Facebook property users), and once it finds users, runs a lookalike algorithm on the list of Facebook seed users to identify the lookalike users.
A lookalike percentage is what defines the closeness of match of a lookalike audience to the characteristics of the seed audience. The larger the lookalike percentage, the more diluted or less accurate the match between the average lookalike user and the average seed audience user, and vice versa. Larger percentage lookalikes afford a greater pool of users to target, but typically produce lower ROI than smaller percentage lookalikes. At current, the smallest lookalike percentage is 1%, and the largest is 10%.
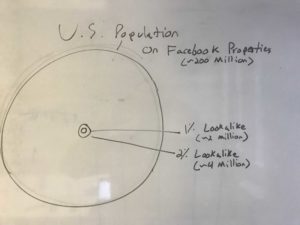
A lookalike country source is what defines the scope of the matching, or the total population of people to match within. For example, the US population on Facebook is some 200 million users, meaning that a 1% lookalike audience in the US would be ~2 million, and a 10% lookalike audience in the US would be ~20 million. Lookalike percentages produce the same sized lookalike audiences, regardless of the size of the seed audience. Lookalikes sourced from multiple countries determine the percentage of the total combined population of all countries included.
This may also be one reason as to why Facebook bought WhatsApp. Facebook needs data on users to power its machine learning and provide the best results for advertisers. WhatsApp provides Facebook with a treasure trove of data in international markets, where its Facebook/Instagram apps have lower penetration rates (i.e. less data on users). Increasing the seed audience match rates and lookalike confidence levels is one direct application of WhatsApp data.
What is lookalike saturation?
Because lookalikes are generally small (recall that a 1% lookalike in the US is ~2 million users), lookalikes are limited in the total number of users that they can possibly target with ads and therefore convert into users. Due to this limitation, lookalikes, just like any audience can experience saturation. Saturation is not an officially defined term but refers to the tendency for campaigns running against a constant audience target to reach a point of rapidly diminishing returns. Saturation can be observed as a decline in metrics of scale (e.g. installs) and/or a decline in the metrics of efficiency (e.g. ROAS/return on ad spend).
For example, saturation could be observed by the number of weekly installs falling from 7,000 to 700, and/or the first week ROAS falling from 6% to 2%.
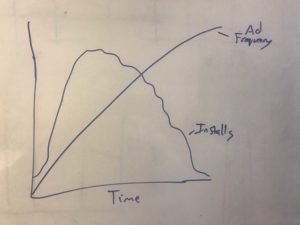
Given that audience engagement rates are a primary cause, lookalike saturation can also be correlated with upstream metrics such as ad frequency, cost per click, and cumulative audience reached.
Why does lookalike saturation occur?
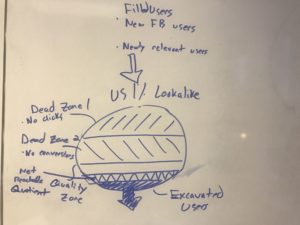
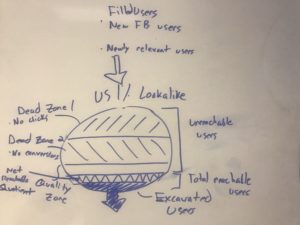
Saturation of lookalikes is caused by three forces: brand awareness/interest, audience excavation, and the effective net reachable quotient.
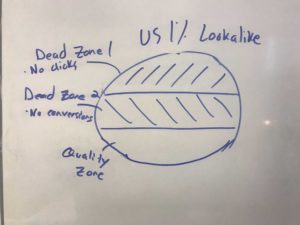
Brand awareness/interest is a loose term used to describe the dynamics of user interactions with an app’s ads. While lookalikes will always contain a certain number of users, there will be a certain number of users within the lookalike that will not A) click on an ad and/or B) convert into becoming users/customers of the advertiser.
- Users who will not click can be referred to the “Dead Zone 1” of a lookalike. These users are a negative force, as they will drag down a campaign’s CTR.
- Users who will click, but will not convert are referred to as “Dead Zone 2” of a lookalike. These users are a negative force, as they will drag down a campaign’s CVR.
- Users who may click and may convert are referred to as the “Quality Zone” of a lookalike. A percentage of these users are a positive force, as they will raise the CTR and CVR, and ultimately convert.
While users in the dead zone 2 may click, they are considered a part of the total dead zone because they will not convert. That said, a lookalike’s total “dead zone” constantly changes over time, due to changes in brand awareness/interest and audience excavation.
The membership of dead zones and quality zones is not fully known to any party, including the advertiser and Facebook, because behavior (i.e. the conversion rate of a user) is impossible to fully predict before it occurs.
Yet, in terms of data, an app’s overall brand awareness/interest can be observed in the form of CTR (click-through-rate; dead zone 1) and CVR (conversion rate; dead zone 2). (For a relevant audience) the higher the brand awareness, the higher the likeliness that a user will click on an ad; the higher the user’s interest in the brand, the higher the likeliness that a user who clicks will convert. The higher both of these interaction factors (as compared to other advertisers targeting those users), the smaller the total dead zone and the lower the risk of saturation, and vice versa.
In tying these concepts together, take the example of Netflix and Yousician:
- If Netflix and Yousician were to both compete for the same audience, Netflix would likely have a higher brand awareness (i.e. CTR) and brand interest (i.e. CVR) than Yousician.
- Netflix therefore would have a smaller total dead zone, or conversely a higher quality zone than Yousician.
- Both Netflix and Yousician would perform well when serving ads to users in the quality zones of the lookalike audience.
- But, Yousician would be likely to saturate the lookalike audience at a faster rate than Netflix.
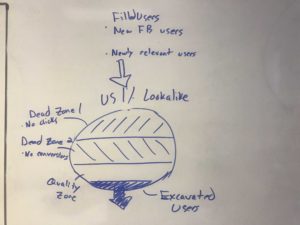
Audience excavation is a negative factor and is observed as the rate at which users who convert the campaign objective are excluded from a lookalike. For example, using the “exclude users of my app” feature excavates users who have an app installed from the lookalike, requiring new users to be added to the lookalike in order to maintain the same % of the total source country population.
Furthermore, excavation happens from Facebook advertising, as well as other marketing efforts (e.g. Google advertising), so long as Facebook has data on which users have the app installed.
Audience excavation is tempered by the re-filling of the audience with A) newly relevant users (vis-à-vis updated lookalike connections) and B) new Facebook users (i.e. net-new or re-activated Facebook users).
With regard to adding newly relevant audience members, one additional concept to consider is whether Facebook’s data visibility is of a high enough quality to fill in new users who are as valuable or more valuable than the excavated users.
For instance, say Facebook’s lookalike algorithm has enough data to build a 1% lookalike list with an R-squared or other accuracy metric describing the quality of the match of 90%. As users are excavated, the total lookalike audience must float at ~2 million users, meaning that Facebook must re-fill the audience. Because the total number of users in the lookalike is held constant, the quality of the users re-filled may not be held constant; perhaps based on the new connections made, the new users filled into the lookalike audience will have an R-squared of only 85%, leading to quicker saturation.
The details of fill-rate confidence are not known to parties outside of Facebook, but can be observed in metrics like conversion rate, ROAS, retention rate, etc. The more important thing to note is that new members of a lookalike may not be the same quality as excavated members, which can be a cause of audience saturation.
A lookalike’s net reachable quotient is the percentage within the quality zone that your campaign is eligible to reach. The net reachable quotient is broken down into two main components:
Creative performance – arguably the strongest factor influencing the net reachable quotient are your creatives. Facebook prefers to show fresh or viral content (i.e. high CTR/CVR/social engagement) to users in order to encourage them to continue using Facebook. If your creative is not fresh or proves not to be viral, Facebook lacks incentive to allocate more of a lookalike’s quality zone to your campaigns, meaning that your net reachable quotient will be smaller, and your lookalikes will saturate faster.
Good creative performance often leads to positive feedback loop, where Facebook’s auction dynamics recognize good creative with a higher and higher net reachable quotient and the higher conversion rate from the good creative transforms more clicks into users. The opposite is also true, wherein poor creative performance begets a negative feedback loop.
Facebook’s tendency to show viral content, even if it is of a highly negative sentiment has been one area in which Facebook’s auction dynamics have caused it to take heat in the press.
Bid/budget are limiting in nature and based on their values and the dynamics of the auction. Bid and budget in effect merely serve to hinder your ability to maximize your net reachable quotient of a lookalike to a greater or lesser degree. To a point, the higher your bid and budget, the more incentive Facebook has to raise the net reachable quotient, but the less cost-effective users acquired will be.
After removing the two dead zones and factoring for Facebook’s net reachable quotient, we uncover the total reachable sub-segment of a lookalike. The smaller this sub-segment and the faster the excavation rate, the faster a lookalike audience will saturate.
That’s all for today! Stay tuned for part 2, which will cover the top tips on what to do when your campaigns experience lookalike saturation.
Be sure to bookmark our blog, sign up to our email newsletter for new post updates and reach out if you're interested in working with us to optimize your app's ASO or mobile marketing strategy.
Incipia is a mobile marketing consultancy that markets apps for companies, with a specialty in mobile advertising, business intelligence, and ASO. For post topics, feedback or business inquiries please contact us, or send an inquiry to projects@incipia.co
Categories
Tags:
- A/B testing
- adjust
- advertising
- adwords
- agile
- analytics
- android development
- app analytics
- app annie
- app development
- app marketing
- app promotion
- app review
- app store
- app store algorithm update
- app store optimization
- app store search ads
- appboy
- apple
- apple search ads
- appsee
- appsflyer
- apptamin
- apptweak
- aso
- aso tools
- attribution
- client management
- coming soon
- design
- development
- facebook ads
- firebase
- google play
- google play algorithm update
- google play aso
- google play console
- google play optimization
- google play store
- google play store aso
- google play store optimization
- google uac
- google universal campaigns
- idfa
- ios
- ios 11
- ios 11 aso
- ios 14
- ios development
- iot
- itunes connect
- limit ad tracking
- ltv
- mobiel marketing
- mobile action
- mobile analytics
- mobile marketing
- monetization
- mvp
- play store
- promoted iap
- promoted in app purchases
- push notifications
- SDKs
- search ads
- SEO
- skadnetwork
- splitmetrics
- startups
- swift
- tiktok
- uac
- universal app campaigns
- universal campaigns
- user retention
- ux
- ux design