Incipia blog
KPIs for Measuring the Success of App Store Optimization
One of the most important questions to ask in ASO is: "how do we know our ASO efforts are producing a tangible impact on installs and revenue?"
While this is a simple question to ask, it is a difficult question to answer as the algorithms that govern the fate of millions of apps are constantly evolving which can cause swings in performance, and also isolating a specific optimization and cutting out noise is also tough; indeed all manner of data attribution/analytics technologies have sprung up with solutions because of these problems.
Today's article focuses on some tips for clients and bosses, app marketing managers and consultants alike to deduce the impact of an app store optimization strategy:
Step one: Familiarize yourself with the full impact of an ASO strategy
App store optimization, like SEO is made up of many activities, each of which individually and combined produce many outcomes. Here is a list of some of the most important places to look when determining the return on ASO:- Installs - are you driving more installs than you were before?
- Revenue - are you earning more revenue than before?
- Keyword rankings - are you ranking for more important keywords than before, at higher ranks?
- Category rankings - are you ranking higher in your category than before?
- Conversion rate - are you converting more store impressions to app views, and app views into installs at a better rate than before?
Image credit: App Annie
Step two: Know your metrics and KPIs
Get to know the data and love it, too. We wrote a popular post and made an infographic detailing some KPIs and metrics for app marketing in general, but here are some metrics and KPIs specifically for analyzing the efficacy of an app store optimization strategy: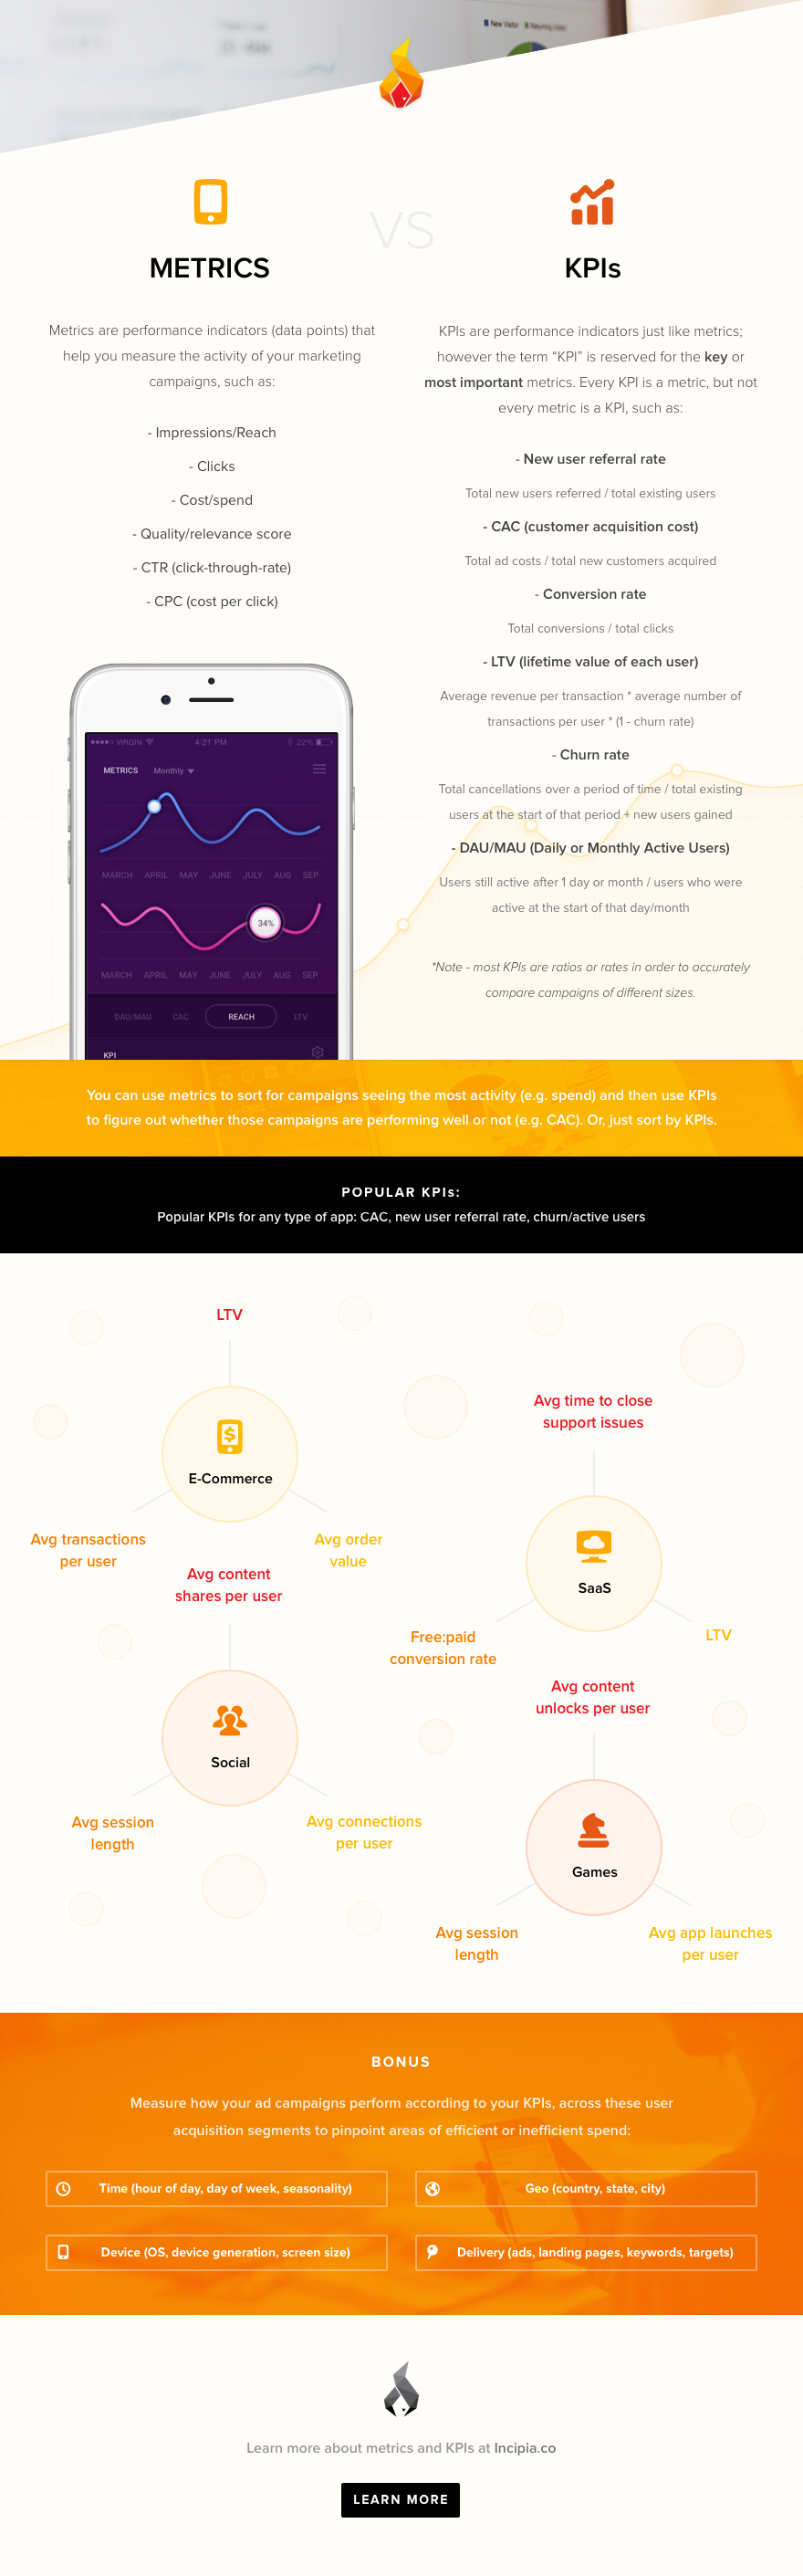
- App/Play store:
- KPI Higher installs - "up and to the right" installs is the single most common method of analyzing the impact of ASO.
- Higher revenue or number of buyers - Crafting the right messaging to prime users to purchase or ranking for keywords that attract higher value users can improve ARPU; or vice versa.
- Higher app store impressions - the newly released store impressions allow you to more effectively see whether ASO causes an app to receive more keyword searches. It's easier to distinguish whether ASO produces a sustained increase in impressions than installs because there is much more data available on the former.
- Higher product page views - turning more impressions into actual app views is a good sign for measuring how well optimizing your icon/screenshots/title/rating goes.
- Higher keyword rank - while ranking highly for a keyword is a good indicator of progress, some keywords have lower volume than others, leaving a high rank for such keywords a hollow victory, unless correlated with an increase in installs.
- Higher retention/engagement - similar to revenue, attracting and acquiring more users who are higher value is good for business and will lead to higher retention and engagement rates.
- A/B testing (Google Play, Store Maven or Splitmetrics) - these tools will tell you with statistical significance whether your app store optimization produced better results than the prior version. Essentially these tools serve the answer to the question this post is all about, on a silver platter.
- Additional data points - good ASO strategy doesn't just focus on optimizing keywords or screenshots in a store listing to drive more installs, but encompasses what happens to users in the app itself. Here are some additional data points that are important to look at when trying to understand the impact of an ASO strategy:
- Higher number of in-app events - while revenue and number of buyers from in app purchases is tracked in the app stores, apps without in app purchases should analyze the impact on their key in-app events.
- High number of (4 and 5 star) reviews - optimizing a review flow is a crucial part of ASO and should be analyzed as well as installs.
- High push campaign engagement - push campaigns can increase user retention and thus rankings, placing push campaign optimization in the remit of ASO.
Image credit: Splitmetrics and Google Play Console
Step three: Establish normalcy benchmarks and mark caveats
Once you've determined where to look and which metrics to look at, it's time to determine what the expected or average performance looks like so that you can differentiate good, no-effect andThat said, beware that other marketing activities such as PR or social media marketing can skew KPIs and obscure your ability to attributable results to any one marketing signal (unless you use an attribution or A/B testing tool).
For example:
- Receiving PR can cause a spike in searches and installs that has little to do with ASO.
- Releasing a new version on iOS will reset your ratings and star count, which can temporarily reduce your ASO performance just for that reason.
- Launching a sale can effect your revenue and retention rate.
Subtracting installs attributable to external marketing efforts (e.g. Adjust or Appsflyer for paid marketing or Branch Metrics for organic marketing) from total installs can leave organic installs behind, but keep in mind that driving more external installs increases your category and keyword rank, which can produce more installs via an organic multiplier effect.
On the other hand, consider point #5 from step one that an optimized app listing (e.g. icon, screenshots, description, etc.) can increase the effectiveness of external marketing efforts by improving click-to-install conversion rates. Establish normalcy of conversion rate for your external app marketing efforts and then compare your conversion rate post-ASO to determine the specific impact of ASO.
That is: if your Facebook conversion rate before implementing ASO is 5% and your conversion rate (absent any optimizations of your Facebook ads campaigns) is 10%, then the 5% improvement and the cost savings and extra revenue generated could be attributed to your ASO efforts.
Step four: Try to change only one thing at a time
While it may be tempting to throw a lot of changes at the wall to see what sticks - this is not a smart practice in ASO as it will leave you guessing at which change you made caused a performance change, even if you do use an A/B testing tool.Although A/B tools make analyzing the performance from multiple variants quite easy and provide statistical significance, you lose meaning in the results if you test more than one change per variant. If you change screenshots AND you change your title AND you change your icon at the same time, you won't be able to determine which change produced the change in performance.
While iOS does not allow you to A/B test and requires a new build to be submitted before changing the title, screenshots, icon, video or keywords, you can change the description between builds.
Step five: Track and correlate
After implementing an optimization, it's time to correlate. If you don't have the luxury of an A/B testing tool telling you whether your optimization produced a better result, one of the most common forms of correlation is pre-post analysis.The simplest way to correlate pre-post changes is to pull a report and average your KPI over a period of time leading up to the day you implemented an optimization, and then compare that pre performance with the performance over the same period of time post optimization. The most used period of time is an increment of 7 days (one full week) such as 7, 14, 21 or 28. For example, this change below produced an improvement in driving install volume of +52%, meaning that this tactic was indeed successful.
Be aware, though that changes based on small datasets can cause correlations to be non-significant, which means that there weren't enough observations of the outcome to confidently say the optimization worked. In the above example, if we had only 5 installs per week before and 7 after, a 40% improvement would be non-significant because we had such low install volume.
When measuring pre-post changes, also be sure to use the same context (keep as much the same as possible for the pre and post datasets). For example, Do compare the 7 days prior to the change with the same 7 days of the week following the change. Yelp below sees its highest rank on Saturdays, meaning that analyzing a Friday optimization on Saturday vs Yelp's rank on Thursday will produce skewed conclusion. Here are a few common contexts to consider:
- Time period unit (day/week/month/quarter/season/year)
- Geography (country)
- System or device (android vs iOS, smartphone vs tablet)
Image credit: App Annie
Other Considerations
Here are some other thoughts to keep in mind when analyzing your ASO performance:- A/B testing tools (besides Google) can test your app listing for pre-post performance, but keep in mind that they won't provide you insight into how your keyword ranking would be affected, meaning that you could see more or fewer keyword-sourced impressions accordingly.
- Consider the long-term impact of changes more-so than short-term performance spikes. Spikes in installs, revenue or rank are great, yet they are also often just temporary radar blips, and organic efforts seldom cause traffic spikes.
- When comparing changes, use ratios to ensure that you're comparing apples to apples. A +1,000 increase to 3,000 from a base of 2,000 (+50%) sounds impressive, but it's comparatively less impressive than a +600 increase to 1,000 from a base of 400 (+150%).
- That said - the app store and play store algorithms operate on a logarithmic basis, meaning that the higher you climb in rank, the more difficult it becomes. Moving 10% from a rank of 10 to 9 is more impressive than moving 50% from a rank of 500 to 250.
- If you're looking at data on a month over month basis, the best data range to use is that of February: 28 days. This is because 28 days contains exactly 4 weeks, meaning that you won't get an extra weekend in one period of time vs the other.
- Be aware that running Facebook ads can inflate your product page views such as in the image below, which can throw off your ASO analysis.
- Lastly - consider the direction of your app's ranking momentum: if your app has been falling in rank before implementing an optimization such as attempting to rank higher for a keyword, it will produce worse results than if your app's rank was stable or rising, because installs affect your app's ability to rank for a keyword.
That's all for now folks! Thanks for reading - stay tuned to the Incipia blog or subscribe to our email list for more information on app store optimization and marketing strategies.
Incipia is a mobile app development and marketing agency that builds and markets apps for companies with a development speciality in high quality code architecture and keyword-based marketing optimizations. For blog/video or speaking requests, business or press inquiries please contact us at hello@incipia.co.
Categories
Tags:
- A/B testing
- adjust
- advertising
- adwords
- agile
- analytics
- android development
- app analytics
- app annie
- app development
- app marketing
- app promotion
- app review
- app store
- app store algorithm update
- app store optimization
- app store search ads
- appboy
- apple
- apple search ads
- appsee
- appsflyer
- apptamin
- apptweak
- aso
- aso tools
- attribution
- client management
- coming soon
- design
- development
- facebook ads
- firebase
- google play
- google play algorithm update
- google play aso
- google play console
- google play optimization
- google play store
- google play store aso
- google play store optimization
- google uac
- google universal campaigns
- idfa
- ios
- ios 11
- ios 11 aso
- ios 14
- ios development
- iot
- itunes connect
- limit ad tracking
- ltv
- mobiel marketing
- mobile action
- mobile analytics
- mobile marketing
- monetization
- mvp
- play store
- promoted iap
- promoted in app purchases
- push notifications
- SDKs
- search ads
- SEO
- skadnetwork
- splitmetrics
- startups
- swift
- tiktok
- uac
- universal app campaigns
- universal campaigns
- user retention
- ux
- ux design