Incipia blog
iTunes Connect Dashboard Expands Sales & Trends for Subscriptions
Feature Image Credit: Help.Apple.com
In a September 13th update, Apple is now adding more data to its iTunes Connect dashboard in order to support its push for developers to monetize more apps through subscription revenue.
The new additions take place in Sales and Trends Reporting and allow developers to view more information on subscriptions, from active customers to cancellations to growth and top subscription products.
Data points from the report include:
- The number of active subscriptions, which counts both pre-existing subscribers and new subscribers on a particular date.
- A count of daily subscription units.
- A count of daily subscription sales.
- Analyze your push campaign effectiveness for increasing the number of new subscription signups (pre-post).
- Cross-reference your new user acquisition reports with new subscriptions to determine whether you're acquiring quality users and what the lag time in subscribing is.
- Diagnose the overall health of your subscription volume and, with a daily/weekly/monthly revenue goal, determine when you need to turn up your marketing activities to increase subscription cashflows.

Image credit: Help.Apple.com
- Subscription activity, listing a count of the individual subscription events per day including:
- New subscribers
- Renewals
- Reactivations (users who cancelled and returned)
- Refunds
- Cancellations
- The number of active free trials.
- A breakdown, per month of conversion rates per subscriptions and trials, along with average rates over the past 12 months.
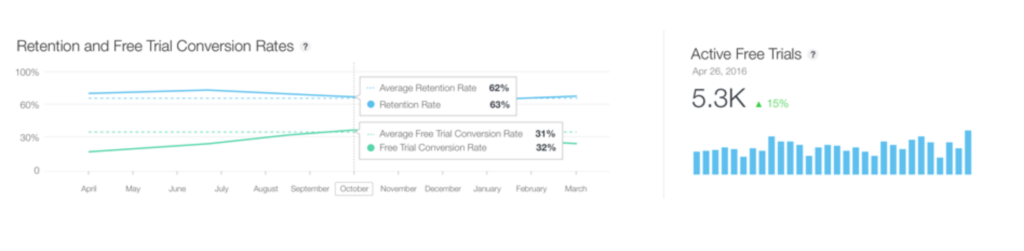
Image credit: Help.Apple.com
- A subscription cohort analysis, showing active subscriptions by starting week, stretching back from the current week. This report is useful for determining the lifetime length of subscriptions, which helps when calculating the lifetime value of your customer (LTV is a must-know number in order to scale effectively, especially when running paid marketing campaigns). You can also use this report to determine how your subscription optimization efforts are doing, similar to the prior conversion rate report, yet this time in terms of total length of each subscription.
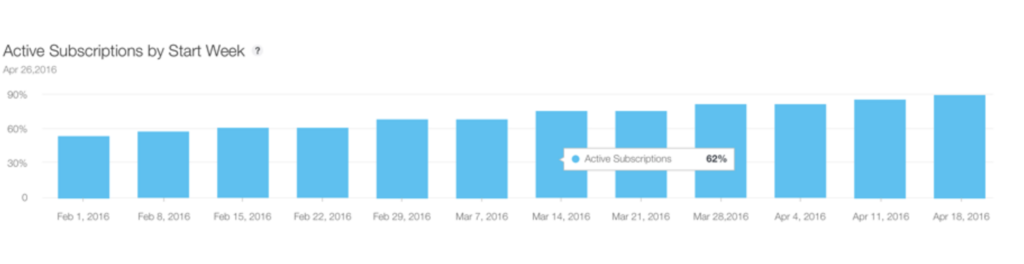
Image credit: Help.Apple.com
- Subscription revenue (by dollar and percentage of the total) of users over time, segmented into those who have been subscribed for over or under 1 year, when Apple's cut of revenues swaps from 30% to 15%. This report is useful for determining how much of your subscription revenue is being earned by higher margin > 1 year users.
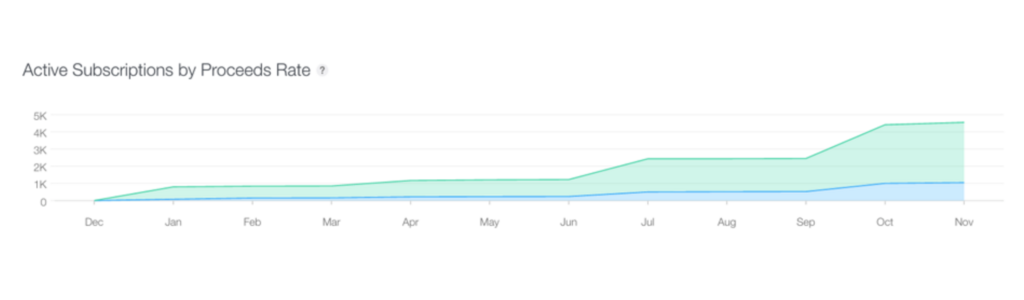
Image credit: Help.Apple.com
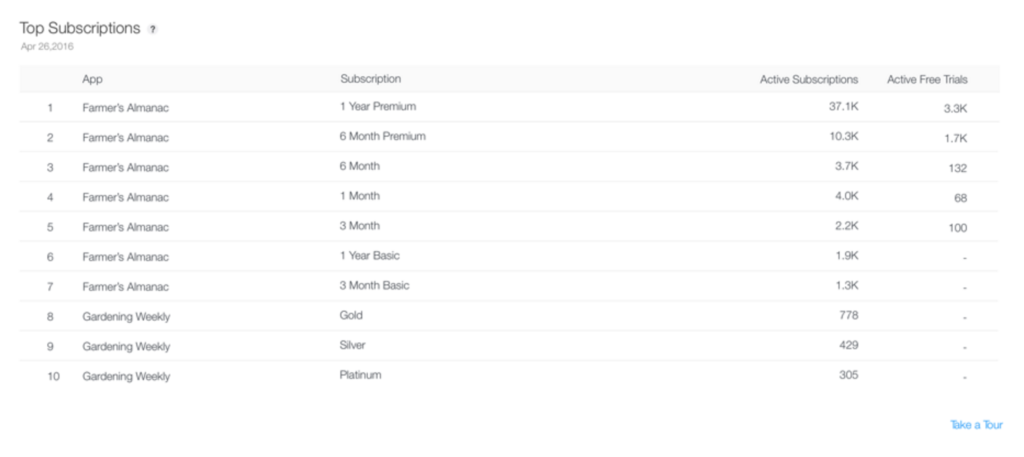
- A list of the top subscriptions for a developer account, by app and subscription name with a count of active subscription and active free trials. Use this report to determine which subscription products are performing better than others in terms of total conversions and free trials. Two other useful data points that can be calculated from this report include:
- Determining the importance of a trial in producing a full subscription for each individual subscription by dividing the number of trials by active subscriptions (as applicable)
- Determining whether free trials lead to more subscriptions in general by segmenting subscriptions into "offers free trial" and "does not offer free trial," and summing the total subscriptions for each segment.
Apple is also offering a couple new reports for developers and marketers, including:
- Subscriptions – higher-level, audience or market data such as active subscriptions by country or subscription ID.
- Subscription Events – a more detailed view within individual subscriptions such as days before cancellation, cancellation reason and days cancelled.
The Bottom Line: Apple continues expanding the iTunes Connect dashboard, now empowering developers and marketers with more data on subscriptions, hoping to boost the amount of recurring revenue and offset declining hardware sales.
That's all for now folks! Be sure to bookmark our blog, sign up to our email newsletter for new post updates and reach out if you're interested in working with us.
Incipia is a mobile app development and marketing agency that builds and markets apps for companies, with a specialty in high-quality code architecture and keyword-based marketing optimizations. For blog/video or speaking requests, business or press inquiries please contact us or send an inquiry to hello@incipia.co.
Categories
Tags:
- A/B testing
- adjust
- advertising
- adwords
- agile
- analytics
- android development
- app analytics
- app annie
- app development
- app marketing
- app promotion
- app review
- app store
- app store algorithm update
- app store optimization
- app store search ads
- appboy
- apple
- apple search ads
- appsee
- appsflyer
- apptamin
- apptweak
- aso
- aso tools
- attribution
- client management
- coming soon
- design
- development
- facebook ads
- firebase
- google play
- google play algorithm update
- google play aso
- google play console
- google play optimization
- google play store
- google play store aso
- google play store optimization
- google uac
- google universal campaigns
- idfa
- ios
- ios 11
- ios 11 aso
- ios 14
- ios development
- iot
- itunes connect
- limit ad tracking
- ltv
- mobiel marketing
- mobile action
- mobile analytics
- mobile marketing
- monetization
- mvp
- play store
- promoted iap
- promoted in app purchases
- push notifications
- SDKs
- search ads
- SEO
- skadnetwork
- splitmetrics
- startups
- swift
- tiktok
- uac
- universal app campaigns
- universal campaigns
- user retention
- ux
- ux design